
THE EXTRACT FROM A BOOK: Ex 1.21 Describe Figure.
Ex 1.21 Describe Figure 4, 5, 6 using words and words combinations from Unit 1.
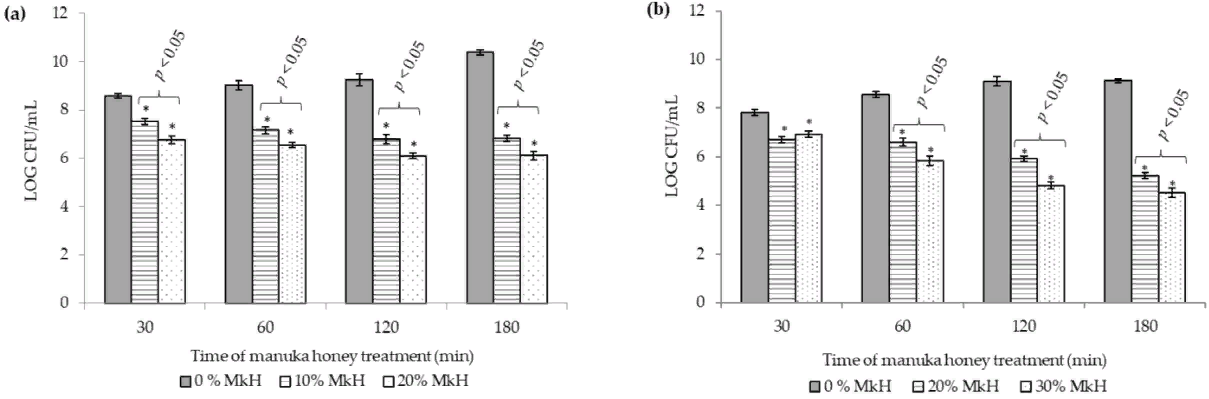
Figure 4. Effect of MkH on S. aureus CECT 86 (a) and E. coli CECT 515 (b) cell viability assessed by colony forming units (CFU) counting (expressed in Log10 units) by plating on Mueller-Hinton Agar. Data at each time point corresponds to mean ± standard deviation. NS indicate no significant differences and asterisks indicate significant differences (*: p < 0.05; **: p < 0.01; ***: p < 0.001) between treated cells vs. the control (non-treated cells). p-values, indicate significant differences (p < 0.05) between the two honey concentrations tested.
Abbreviations:
MkH = manuka honey
S. aureus = Staphylococcus aureus (CECT 86)
E. coli = Escherichia coli (CECT 515)
CECT = Spanish Type Culture Collection (CECT in Spanish)
CFU = colony forming units
FC = flow cytometry
At each time point studied (30, 60, 120 and 180 min) NS means that no significant differences were observed between the bacterial populations treated with each honey concentration compared with the control (non-treated bacteria).
DiBAC4(3) is the abreviation used for bis-(1,3-dibutylbarbituric acid) trimethineoxonol.
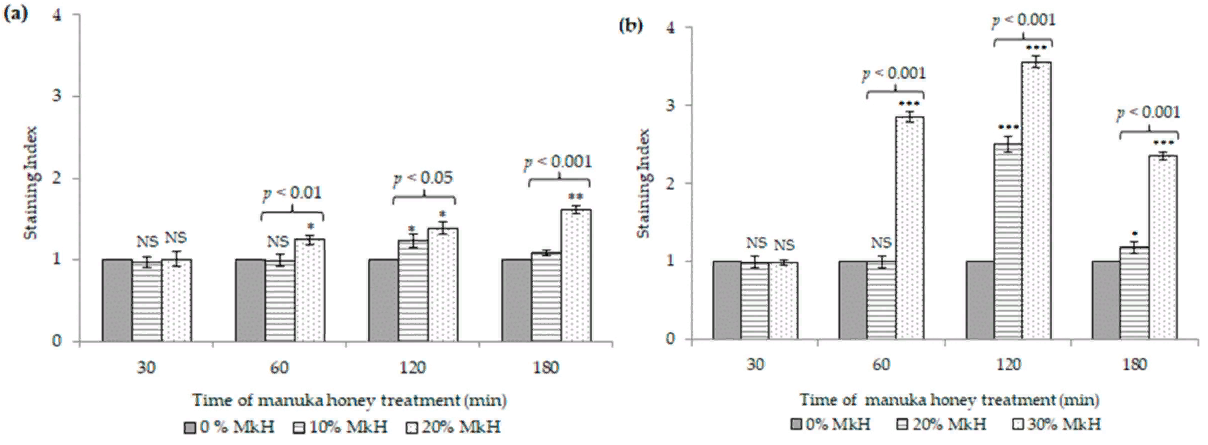
Figure 5. Effect of MkH over membrane potential of S. aureus CECT 86 (a) and E. coli CECT 515 (b), evaluated using DiBAC4 (3) staining. Data at each time point corresponds to mean ± standard deviation. NS indicate no significant differences and asterisks indicate significant differences (*: p < 0.05; **: p < 0.01; ***: p < 0.001) between treated cells vs. the control (non-treated cells). p-values, indicate significant differences (p < 0.05) between the two honey concentrations tested.
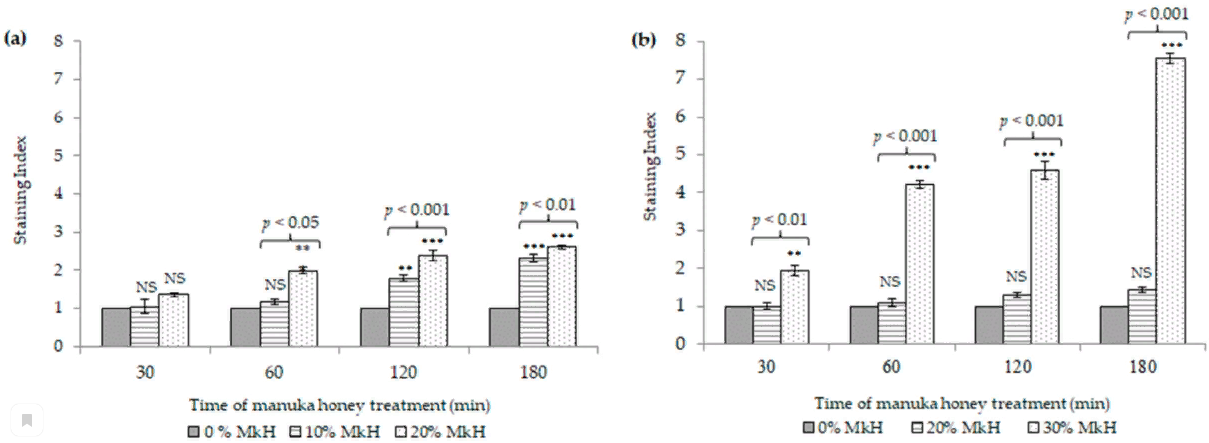
Figure 6. Effect of MkH over membrane integrity of S. aureus CECT 86 (a) and E. coli CECT 515 (b), evaluated using propidium iodide staining. Data at each time point corresponds to mean ± standard deviation. NS indicate no significant differences and asterisks indicate significant differences (*: p < 0.05; **: p < 0.01; ***: p < 0.001) between treated cells vs. the control (non-treated cells). p-values, indicate significant differences (p < 0.05) between the two honey concentrations tested.