
THE ARTICLE: Ex 4.35 Describe Figure 10 using words and words combinations from Unit 4.
Требуемые условия завершения
Ex 4.35 Describe Figure 10 using words and words combinations from Unit 4:
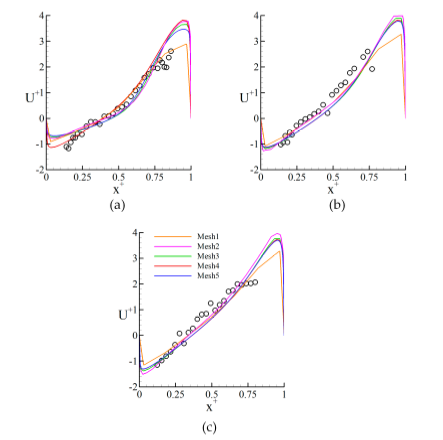
Figure 10. Comparison of experimental and numerical velocity profiles in different streamwise locations: (a) z+ = 0.25, (b) z+ = 0.50, and (c) z+ = 0.75. Symbols represent measured and continuous line represents numerical data.