
THE EXTRACT FROM A BOOK Ex 2.30 Describe the Figure.
Требуемые условия завершения
Ex 2.30 Describe Figure 8 using words and words combinations from Unit 2.
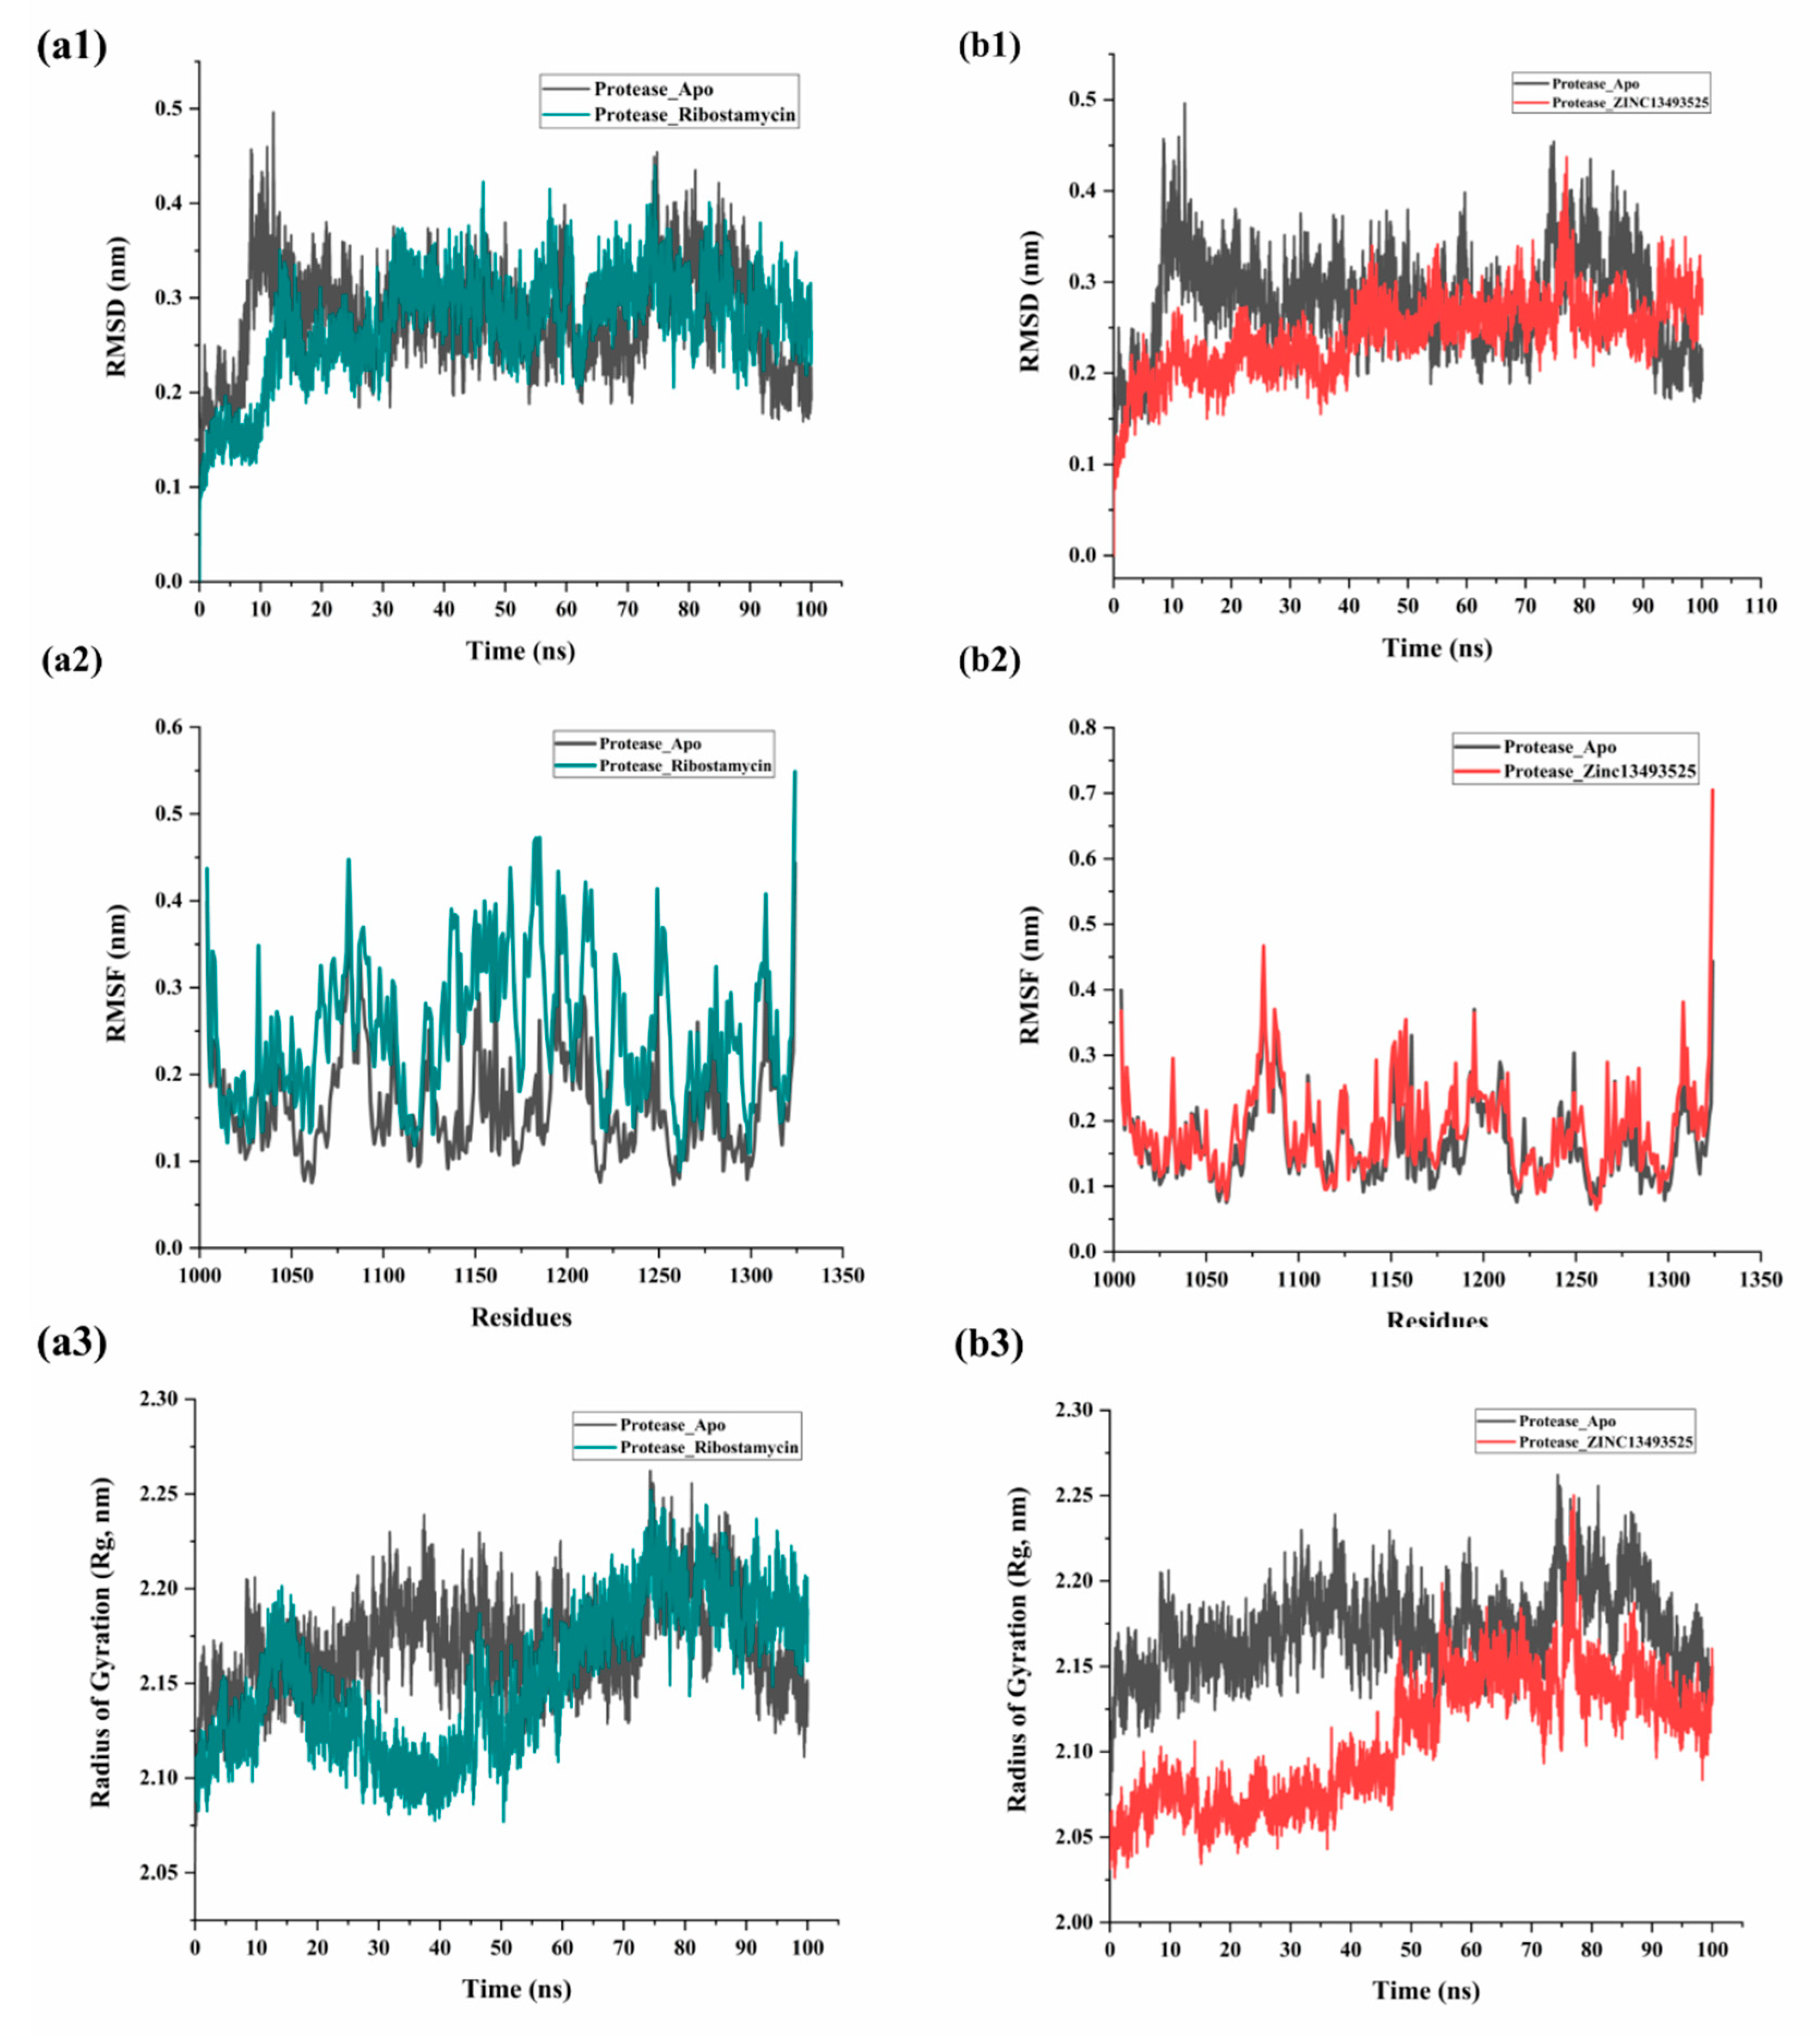
Figure 8. MD simulation analysis of complexes with Ribostamycin sulfate (dark cyan) and ZINC13493525 (E-64) (red) with respect to apo (black) form of CHIKV nsp2 protease: Root mean square deviation evaluation for both complexes are shown in (a1,b1) respectively. Then, RMSF in residues in simulation of 3TRK (1004-1324 residues) before and after binding with compounds are shown in (a2,b2), respectively. Similarly, compactness parameter, radius of gyration (Rg) for both complexes along with apo protein are represented in (a3,b3), respectively.