
Ex 4.9 Write about the effect of pollution on human health.
Look at the human health map of Vilnius City. Read the description. Find the map of your district (town, city) in the Internet and write about the effect of pollution on human health.
Pollution effects on human health map drawn by applying the air quality index (AQi)
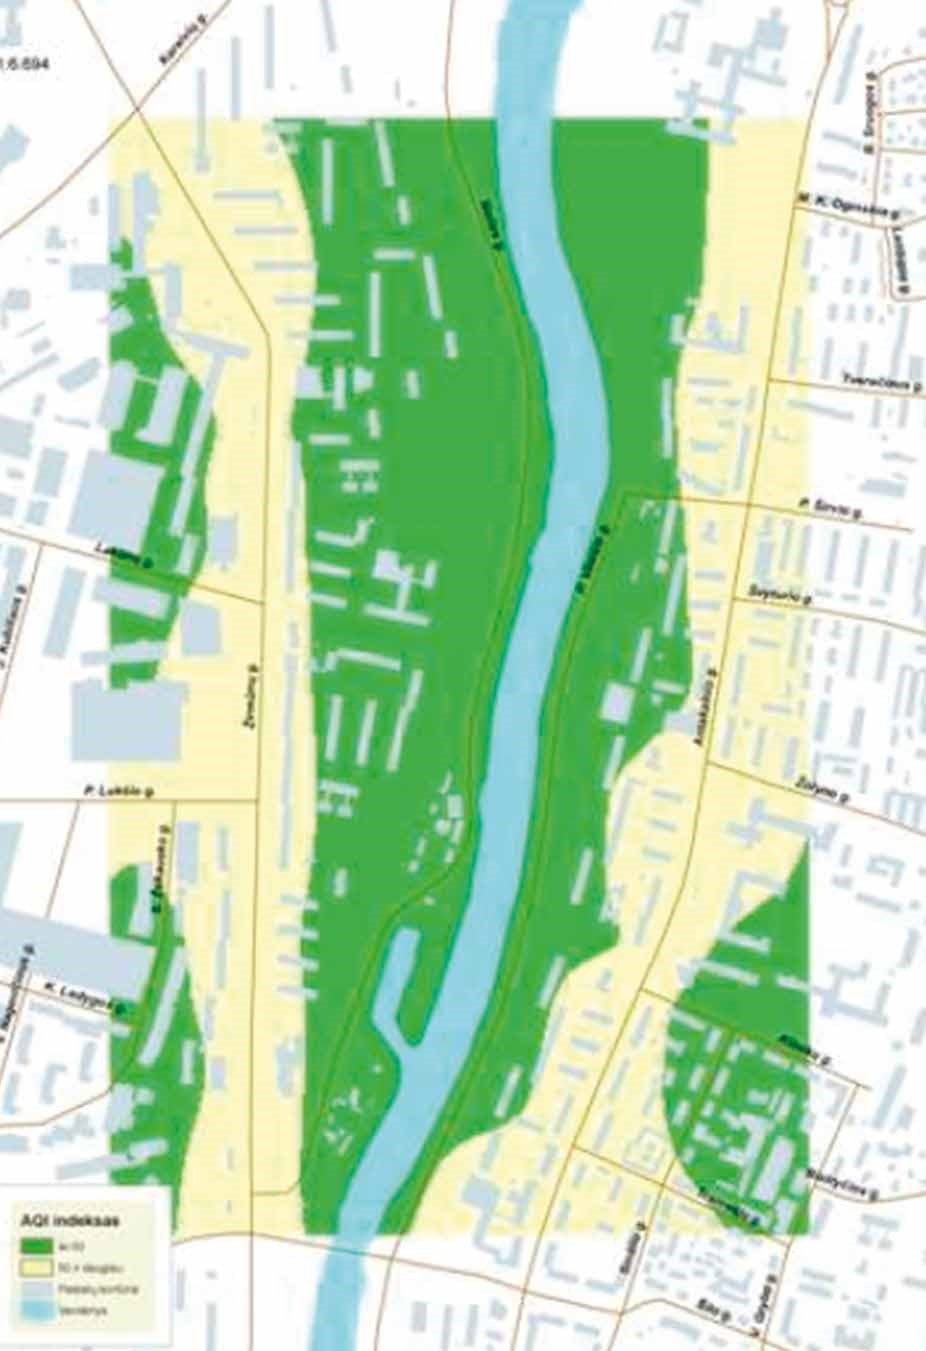
The method provided by the United States Environmental Protection Agency was the means to calculate the air quality index (AQi). It served as the basis for drawing a map on the effect of pollution on human health. It is compiled for a certain, defined zone only, i.e., in this case, for the part of the Antakalnio and Žirmūnų neighborhoods with boundaries of Antakalnio, Žirmūnų, Šilo and Kareivių Streets. The subdivisions of this index are six intervals.
It is possible to determine the level of effect the concentration of pollutants in the environment can have on human health and the illnesses it can cause by applying the Pollution effects on human health map and the aforementioned method. Most of the attention is on heart, blood vessel and respiratory ailments by use of this method. The effect of the named pollutants is established for four groups of certain people: sensitive residents group – people who are already ill with heart, blood vessel and respiratory ailments, children, adults and elderly persons.
The presentation here of the digital map on the air quality index shows that, for the time being, air quality is in a good or satisfactory state. It is noticeable that there is more air pollution alongside the street; therefore air quality changes from good to satisfactory. That means people living alongside the street come into frequent contact with the effects of pollution. This can manifest as discomfort and/or symptoms of respiratory difficulties (especially relevant for the group of sensitive residents). Additionally the work of the heart becomes more diffcult for people suffering from heart failure and for elderly people. It needs mentioning that the calculated values of the air quality index alongside the road in many places were near the third interval, defined as within the limits of being harmful to the sensitive residents group. A growth in the number of sources of mobile pollutants is the forecast for Lithuania’s cities. Therefore, a possible conclusion is that the values of the index can increase along with an increase in the number of target groups.